TIMELINE
3 months, Nov '24 to Jan '25
My role
Design, product strategy, including user research and GTM strategy
Team
myself, PM, Frontend Engineer, BE Engineer
Overview
Redesigned the Token Unlocks dashboard, improving the hierarchy of the essential information and devise ways to provide deeper, contextual insights.
I played a pivotal role in this project by defining product requirements and developing a growth strategy. To drive organic distribution and boost conversions, I proposed making a high-potential, viral section of the product free-to-access.
Half of the improvements detailed in this case study were shipped in Dec 2024 and we are already seeing an uptick in active users. More metrics to come after the project's full release.
Highlights

Historical analysis? We’ve crunched the numbers
BACKSTORY
We heard repeatedly from sales that customers want Token Unlocks, so much so that it was a motivator in signing a 5-figure-plus contract. Given the urgency, in August 2023 I started off with designing a pdf as an MVP which allowed us to get the data in customers’ hand in less than 3 weeks.
I designed the V1 of Token Unlocks which featured a data table explorer and detail pages which was launched in Nov 2023. The product has since achieved a conversion rate of 10%

PROBLEM
V1 design buried the lede
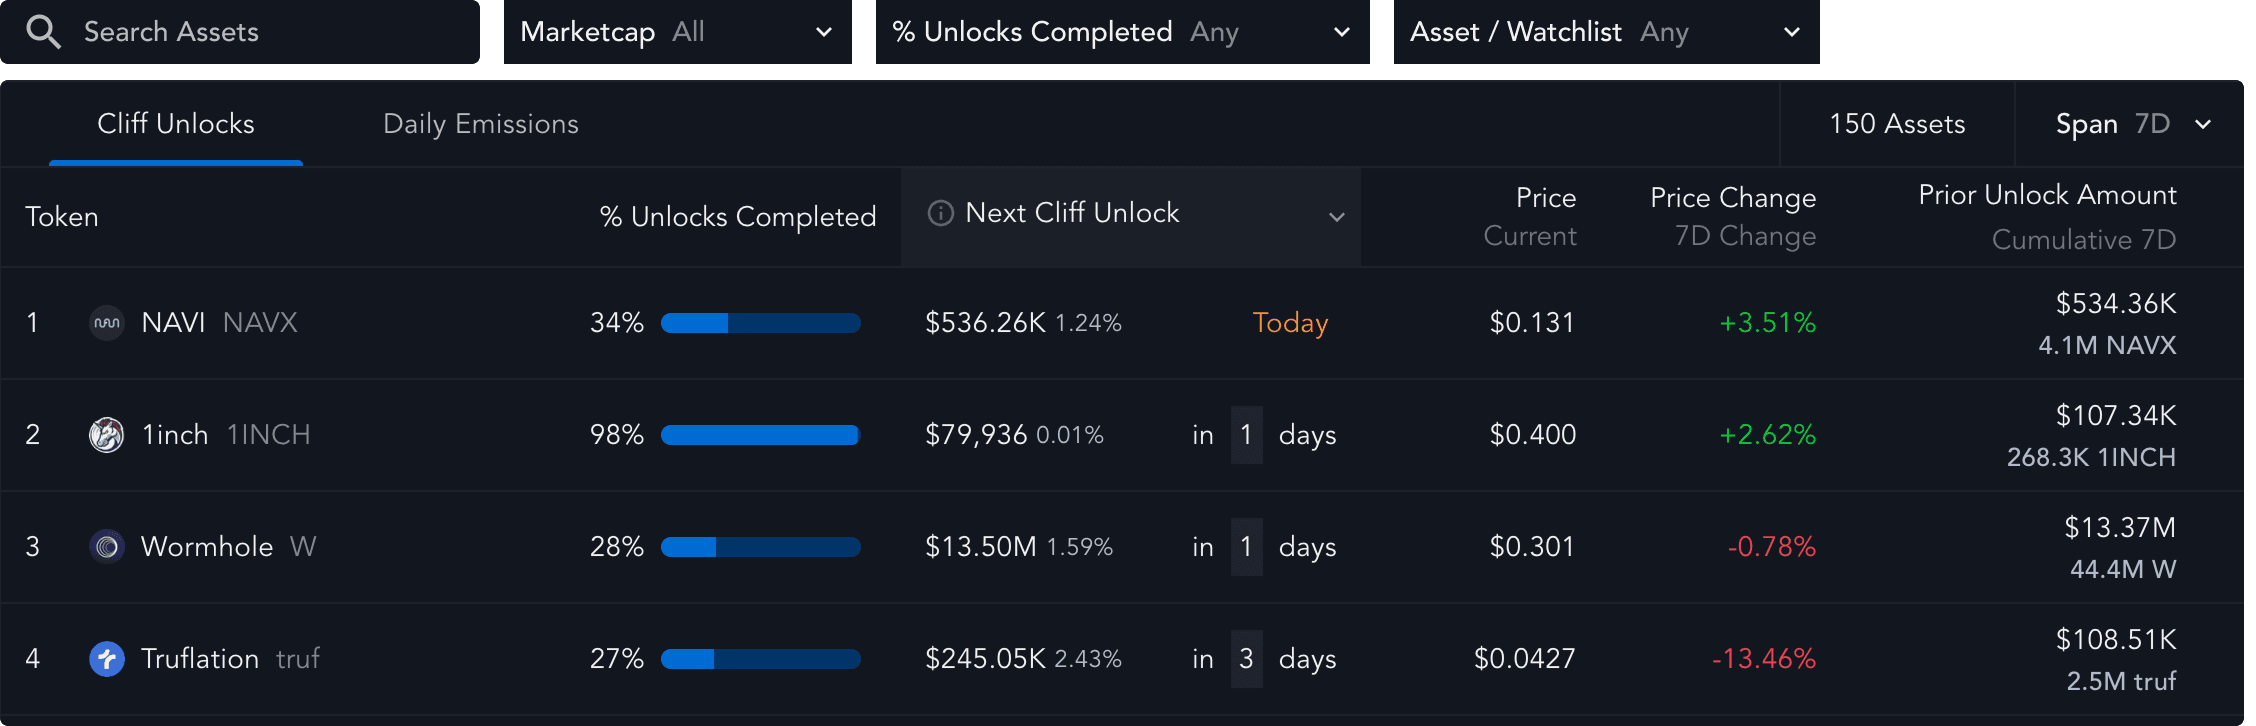
Since the launch of V1, user feedback have said that while the information is valuable, it’s too overwhelming. Clearly, that the data table that our team commonly used was making it hard for users to identify the most actionable insight.

Research & Design direction
Reducing complexity to focus on the essentials
I wanted to know users’ priorities in terms of what they hoped to get from Token Unlocks upon landing on the page. To save time, I conducted internal user interviews. I learned that
Users primarily cared about cliff events, not rate change events
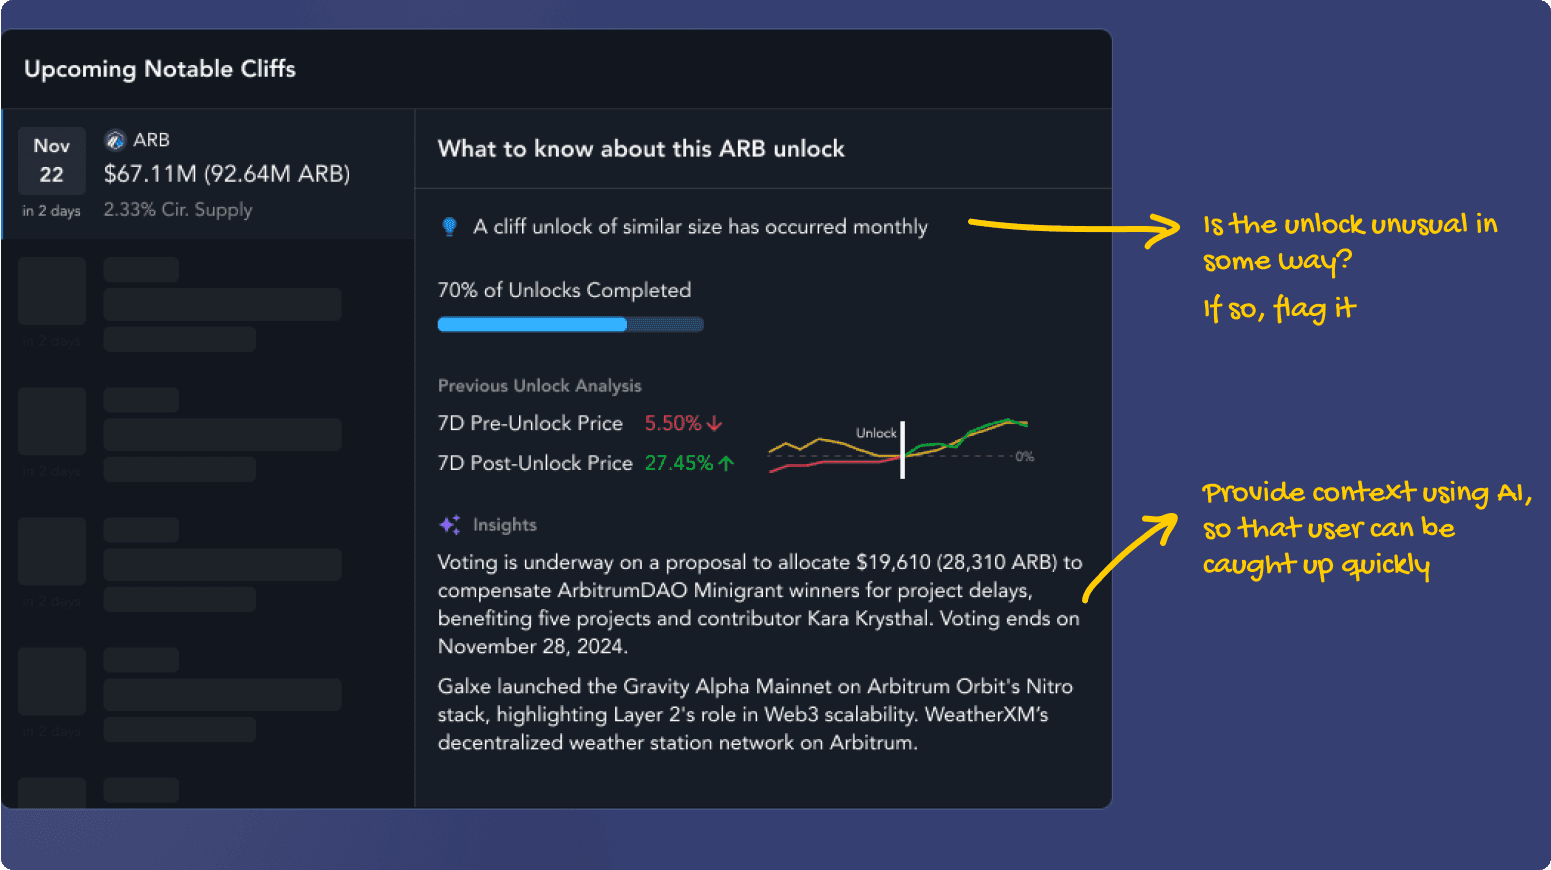
Users wanted more “insights” about the unlock, like whether it’s unusually big
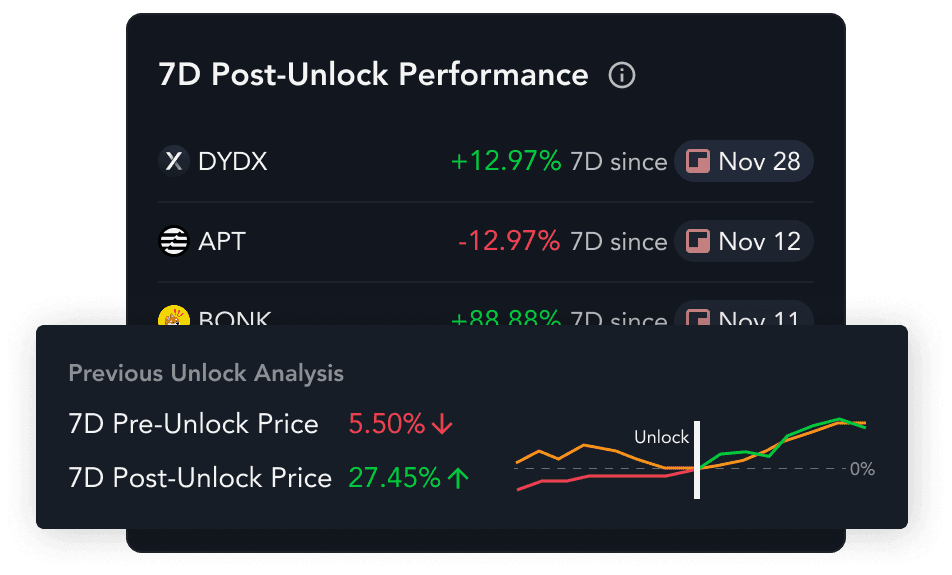
How price reacted for past unlocks can provide useful anchors for an upcoming event
As a response to insight 2, I developed a flagging system that surfaced the most relevant insights at a glance, helping users filter out noise and focus on what matters.
if
unlock amount is biggest of the year

if
event is first of the year
show

if
unlock amount repeats over a period of time, i.e. month
show

Provide data in context to enhance understanding
I learned that many users hear about token unlocks through news articles. These articles provide additional context on the company such as new hires or security hacks. Working with product and engineering, we were able to successfully leverage Messari’s AI Copilot to provide this context.
Striking the balance between density and clarity
From Messari’s own research, we know that the way price react 7 days after the last unlock can tell us a lot about what’s going to happen in the future. The design challenge was to communicate that the % number was 7D after unlock, not compared to the current day. And doing so with
I landed on the design that flowed like natural language, like saying “DYDX went up 12% since Dec 28.” I opted for a list so that we should show as many items as possible while giving the module a news feed feel.

GO-TO MARKET
Experimenting with a growth hack 👀
Companies name their token allocation differently, some may have “founders” and “future team” while others call it “employees.” Our new feature groups similar categories together, e.g. as “Team,” which allows comparison across projects.
Token allocation is a spicy topic, e.g. “X project reserved 50% of their tokens for founders?!” Owning to the controversy, this chart from 2021 goes viral once in a while on social, despite the data being extremely outdated.
Inspired, I proposed making the allocation page free (main feature is paid) to attract traffic and funnel users to the paid Token Unlocks feature.


Reflection
Using design as a way to promote discussions
Token Unlocks 2.0 will be fully launched in Jan 2025! I’m excited to see user feedback and usage analytics post-launch.
In the meantime, this project has been one of the first where I played a strategic role, proposing ideas and planning GTM strategies. It’s a great feeling to see my suggestions being adopted but that outcome was only possible because I used Design not only for mocks, but as a way to promote discussions and get the best ideas from everyone.